Day Trading and Pivot Points
Tomorrow I am conduction an Open Question-and-Answer Session. I invited 40-50 traders and asked them to submit their questions in advance so that we can use our time tomorrow in the most efficient way.
I received more than 20 questions, and one of the frequently asked question is
"How do I use Pivot Points in my day trading?"
Let's first of all answer the question "What ARE Pivot Points?"
When talking about Pivot Points, most traders refer to the so-called "5-point-system". This system uses the previous day's high (H), low (L) and close (C), along with two support levels (S1 and S2) and two resistance levels (R1 and R2). The pivot points are calculated as follows:
R2 = P + (H - L) = P + (R1 - S1)
R1 = (P x 2) - L
P = (H + L + C) / 3
S1 = (P x 2) - H
S2 = P - (H - L) = P - (R1 - S1)
Fortunately, these days there are many free Pivot Point Calculators available, and you don't have to calculate them yourself. Once you have calculated the Pivot Points based on the previous day data, you simply plot them on your chart.
The most common use of these Pivot Points is to use them as support and resistance levels. I don't know of any professional trader who uses only Pivot Points in his day trading. Most traders use them in conjunction with other indicators.
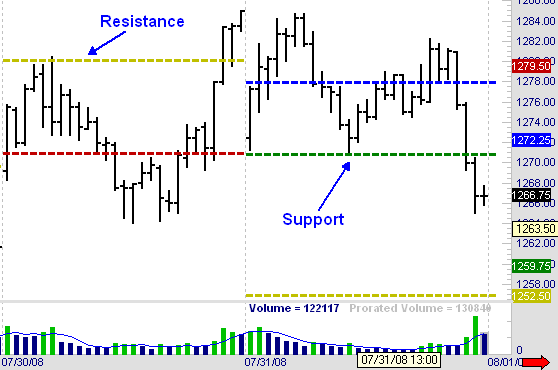
Take a look at the chart below and you see what I mean:

This chart shows the the price action in the e-mini S&P, displayed on 15 min charts. The coloring is a following:
P - Blue (not visible on chart)
R1 - Red
R2 - Yellow
S1 - Green
S2 - Yellow
As you can see, the Pivot Points could be interpreted as support and resistance levels, but they are not a trading system in itself. Some traders use Pivot Point as profit targets or stop loss levels.
Should you use Pivot Points in your day trading?
Well, this depends on your current trading strategy. Plot the Pivot Points on your chart and determine whether they give you any additional information. Can you use them as a filter? Could you use them to narrow your stop loss? Would they keep you out of losing trades and therefore increase your trading performance?
If the answer is yes, then you should update your trading plan and use them.
Otherwise, delete them and keep your charts clean. Your charts should only contain information that you actively use.
Hope that answers this question.
Subscribe Now!
Recent Day Trading Articles
- Do we measure our success rates at different times of the day?
- Why You MUST Stay In Contact With Other Traders
- The Power Of Weekly Profit Goals In Day Trading
- How Many Markets Should You Trade?
- Let Your Profits Run...
- Our Live Day Trading Webinar - A Complete Disaster?
- Finding Trends And Trading Them
- The Sky Is Falling - Time To Panic, Or Is It?
- The $700 Billion Bailout Plan - A Good Idea?
- "Does The SEC Ban On Short-Selling Stocks Affect Your Day Trading?"

