Watch These Support and Resistance Levels When Day Trading
In my opinion the two most important support and resistance level for day traders are the previous day high and the previous day low. Just look at the charts of the past three trading days and you see what I mean:

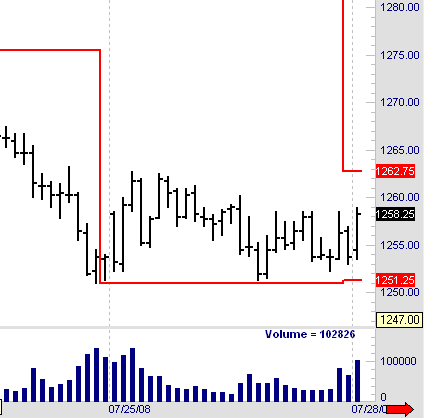
The above chart shows 15min bars of the e-mini S&P. The red lines are the previous day high and low.
Do you see how prices move down to the previous day low on 07-25-2008 and then bounce back?
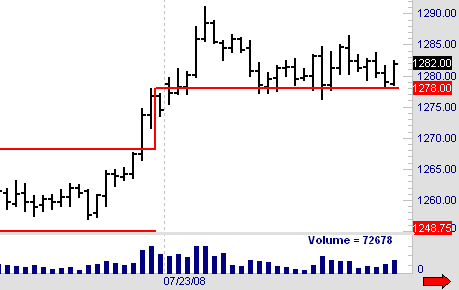
We saw a similar behavior on 07-23-2008:

This time the previous day high acted as the support level. Prices dipped briefly below the support level, but never broke it.
Make sure that you observe these important support and resistance levels when you are day trading. Especially in the stock indices like the e-mini S&P, e-mini Nasday, e-mini Dow, e-mini Russell and other these levels are significant.
Don't trade right into these support and resistance levels. Many times prices fail to break through, and you might be stopped out of your trade. Consider adding a rule toi your trading plan that says "Don't trade into the previous day high or low."
Hope this helps to improve your trading.
Subscribe Now!
Recent Day Trading Articles
- Do we measure our success rates at different times of the day?
- Why You MUST Stay In Contact With Other Traders
- The Power Of Weekly Profit Goals In Day Trading
- How Many Markets Should You Trade?
- Let Your Profits Run...
- Our Live Day Trading Webinar - A Complete Disaster?
- Finding Trends And Trading Them
- The Sky Is Falling - Time To Panic, Or Is It?
- The $700 Billion Bailout Plan - A Good Idea?
- "Does The SEC Ban On Short-Selling Stocks Affect Your Day Trading?"

